
We Simulated 10 Million Crash Game Rounds: Here's What Actually Happens
By Daniel Foster · ✓ Fact-checked by Alex Morgan · Last updated November 2, 2026
On this page
- Key findings
- How we ran it
- 1. What happens to your bankroll
- 2. Bust risk by strategy
- 3. Who actually finished in profit
- 4. Where 10 million crash points landed
- 5. Theory vs reality: the odds hold up
- 6. The streak myth, tested
- 7. How much the house edge matters
- What this means for your play
- Methodology
- Limitations
We ran 10,000,000 crash game rounds and played 13 popular strategies against the exact same rounds. The headline: every single strategy paid back about 97% of what it wagered, Martingale wiped out the bankroll in 87.8% of sessions, a 1.20x auto cash out almost never went bust (0%) but only finished up 1.9% of the time, and “due” multipliers don’t exist: after eight low rounds in a row, the next round hit 2x 47.8% of the time, the same as always. Here’s the full data, the charts, and what it means for how you play.
Key findings
-
Martingale at 2x lost the whole 100-unit bankroll in 87.8% of 10,000 sessions.
-
Auto cash out at 1.20x busted in 0% of sessions, but just 1.9% ended in profit after 1,000 rounds.
-
Auto cash out at 10x finished in profit in 33.6% of sessions, more than any other flat strategy.
-
Martingale with a +20 take-profit ended up 79.1% of the time, and lost everything the other 20.9%.
-
4% of rounds crashed instantly at 1.00x; 51.5% ended below 2x.
-
0.97% of rounds reached 100x or more: about one in 103.
-
After 8 rounds in a row under 2x, the next round reached 2x 47.8% of the time vs 48.5% in theory. No streaks, no patterns.
How we ran it
We generated 10,000,000 crash points from one fixed, published seed using the standard crash formula at a 3% house edge (97% RTP, the same as Aviator). Then we split those rounds into 10,000 sessions of up to 1,000 rounds and played each strategy through the same rounds: a 100-unit bankroll (think $100) and a 1-unit base bet ($1). A session ends early if the bankroll can no longer cover a base bet. We re-ran everything at 1% and 4% house edge to see how much the edge matters. The full method is at the bottom of this page, and the code is public.
1. What happens to your bankroll
Show data table
| Strategy | p10 | p25 | median | p75 | p90 |
|---|---|---|---|---|---|
| Auto cash out 1.20x | 51.6 | 60 | 69.6 | 80.4 | 88.8 |
| Auto cash out 1.50x | 40.5 | 54 | 70.5 | 85.5 | 99 |
| Auto cash out 2x | 28 | 48 | 70 | 92 | 110 |
| Auto cash out 5x | 0 | 20 | 70 | 110 | 150 |
| Auto cash out 10x | 0 | 0 | 60 | 130 | 190 |
| Martingale (2x) | 0 | 0 | 0 | 0 | 410 |
| Anti-Martingale / Paroli | 0 | 0 | 48 | 89 | 128 |
| D'Alembert (2x) | 0 | 0 | 0 | 0 | 0 |
| Fibonacci (2x) | 0 | 0 | 0 | 0 | 276 |
| Dual bet 1.20x + 10x | 0 | 0 | 0.8 | 98.4 | 164 |
| 2x with stop-loss/take-profit | 50 | 50 | 68 | 90 | 110 |
| Martingale + take-profit +20 | 0 | 120 | 120 | 120 | 120 |
| 1.50x with stop-loss/take-profit | 69.5 | 70 | 70 | 84 | 105 |
Embed this chart
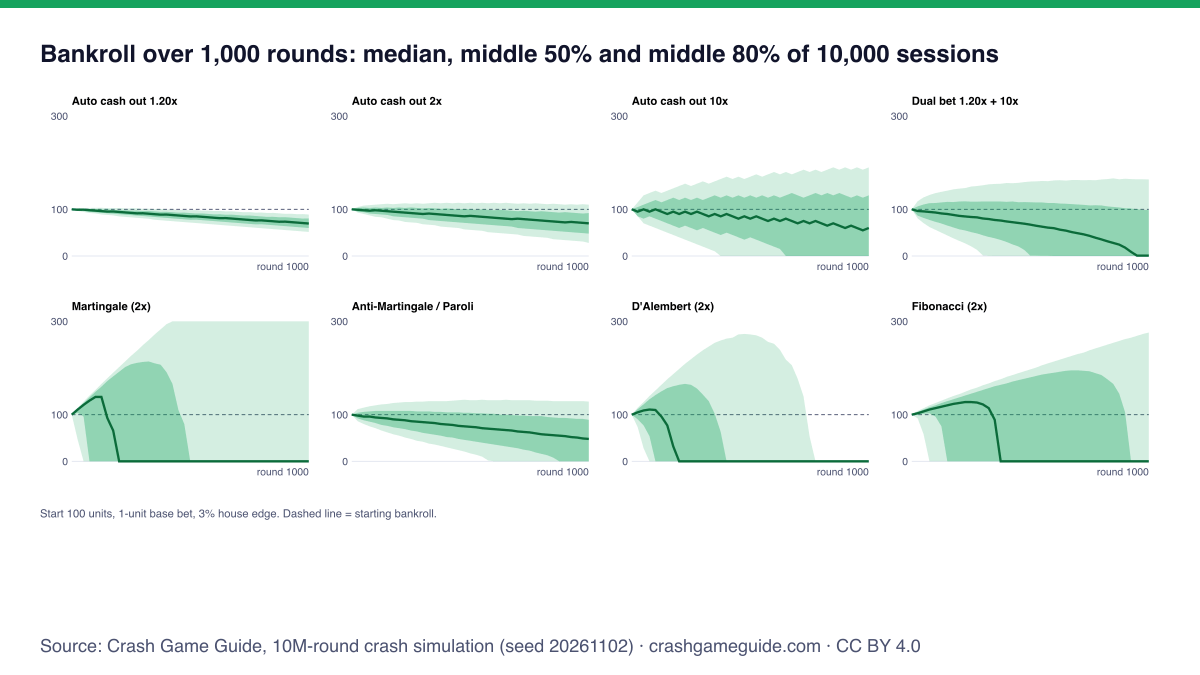
The dark band is the middle half of all sessions, the light band the middle 80%, and the line is the median. Flat auto cash outs slide down slowly and predictably: a 1.20x player who starts with $100 typically ends 1,000 rounds with about $69.6. Progressions look great early (Martingale’s median climbs past $130) and then fall off a cliff as one long losing run wipes out the stack.
Pro tip: if you love progressions, the fan chart is your argument for a hard take-profit. The early climb is real; it just doesn’t last.
2. Bust risk by strategy
Show data table
| Strategy | % |
|---|---|
| D'Alembert (2x) | 93.7% |
| Martingale (2x) | 87.8% |
| Fibonacci (2x) | 76.8% |
| Dual bet 1.20x + 10x | 52.5% |
| Auto cash out 10x | 39.5% |
| Anti-Martingale / Paroli | 31.7% |
| Auto cash out 5x | 21.8% |
| Martingale + take-profit +20 | 20.9% |
| Auto cash out 2x | 2.2% |
| Auto cash out 1.50x | 0.1% |
| Auto cash out 1.20x | 0.0% |
| 2x with stop-loss/take-profit | 0.0% |
| 1.50x with stop-loss/take-profit | 0.0% |
Embed this chart
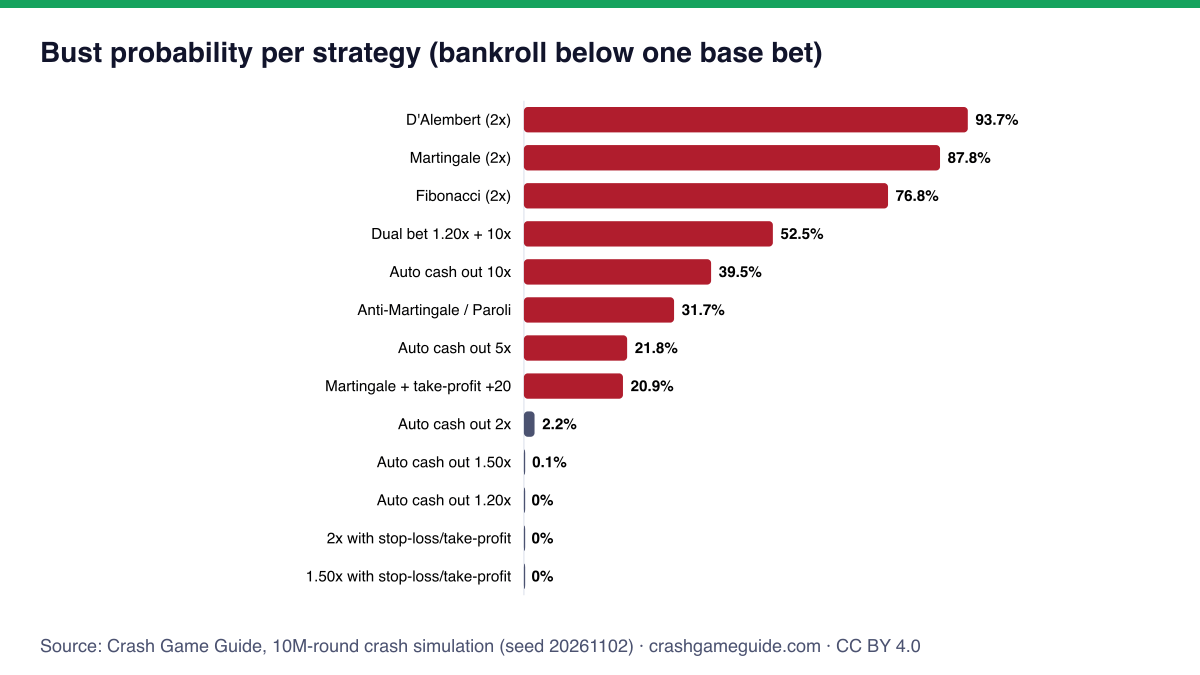
Doubling systems bust because a losing run at 2x is far more common than it feels. Martingale (87.8%), D’Alembert (93.7%) and Fibonacci (76.8%) all burned through the bankroll in most sessions. Martingale sessions that busted lasted 233 rounds on average. Meanwhile a 1.50x auto cash out busted in only 0.13% of sessions.
3. Who actually finished in profit
Show data table
| Strategy | % |
|---|---|
| Martingale + take-profit +20 | 79.1% |
| Auto cash out 10x | 33.6% |
| Auto cash out 5x | 29.8% |
| Dual bet 1.20x + 10x | 24.5% |
| Fibonacci (2x) | 22.9% |
| Anti-Martingale / Paroli | 19.6% |
| 2x with stop-loss/take-profit | 16.1% |
| Auto cash out 2x | 16.1% |
| 1.50x with stop-loss/take-profit | 12.3% |
| Martingale (2x) | 12.0% |
| Auto cash out 1.50x | 9.4% |
| D'Alembert (2x) | 6.1% |
| Auto cash out 1.20x | 1.9% |
Embed this chart
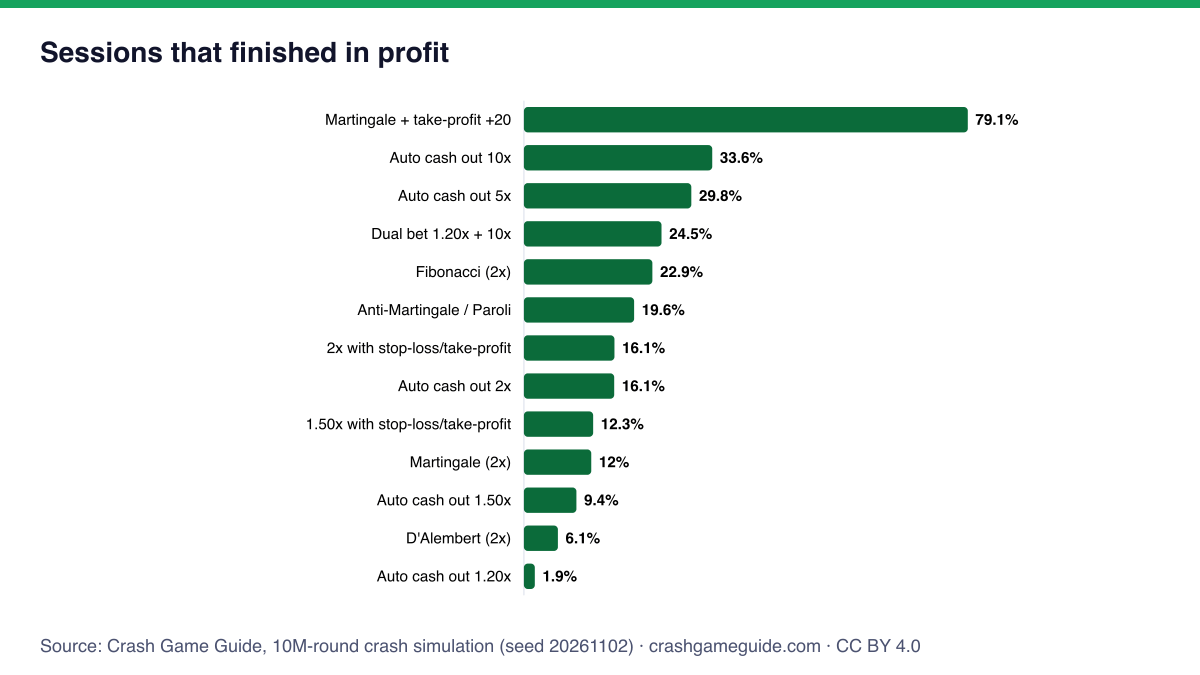
This is the chart most players care about. Win chance per session and win chance per round are very different things: 1.20x wins about 80.8% of rounds, yet almost never ends a long session up. Higher targets win far fewer rounds (10x hits 9.7%) but each win is big enough that a third of sessions end ahead. The biggest single win in the 10x sessions was 9 units on a 1-unit bet.
4. Where 10 million crash points landed
Show data table
| % | |
|---|---|
| 1.00x (instant crash) | 4.0% |
| 1.01x–1.49x | 31.4% |
| 1.50x–1.99x | 16.2% |
| 2x–9.99x | 38.8% |
| 10x–99.99x | 8.7% |
| 100x+ | 1.0% |
Embed this chart
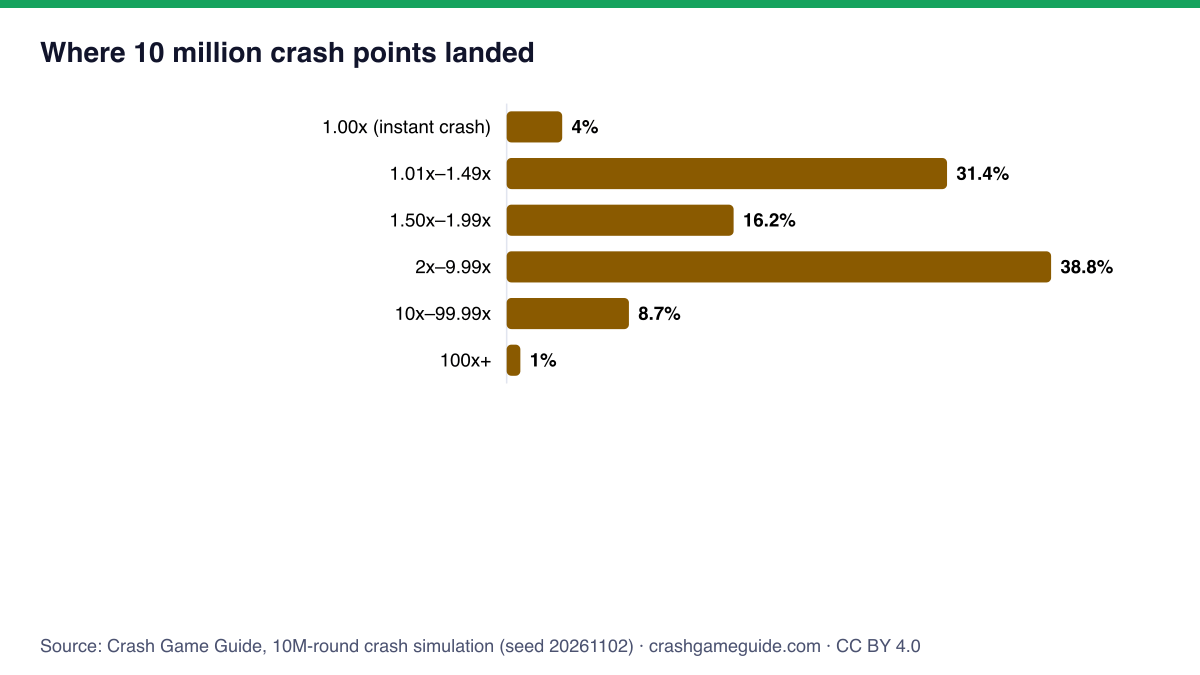
More than half of all rounds (51.5%) crash before 2x, and about 1 in 25 crash instantly at 1.00x before anyone can cash out. The highest crash point in 10 million rounds was 30,633,223x (the formula has no ceiling; real games cap the maximum win). The median round crashed at 1.93x.
5. Theory vs reality: the odds hold up
Show data table
| x | Observed (10M rounds) | Theory |
|---|---|---|
| 1.2x | 80.835% | 80.833% |
| 1.5x | 64.653% | 64.667% |
| 2x | 48.485% | 48.500% |
| 3x | 32.303% | 32.333% |
| 5x | 19.381% | 19.400% |
| 10x | 9.690% | 9.700% |
| 20x | 4.852% | 4.850% |
| 50x | 1.940% | 1.940% |
| 100x | 0.973% | 0.970% |
| 1000x | 0.098% | 0.097% |
Embed this chart
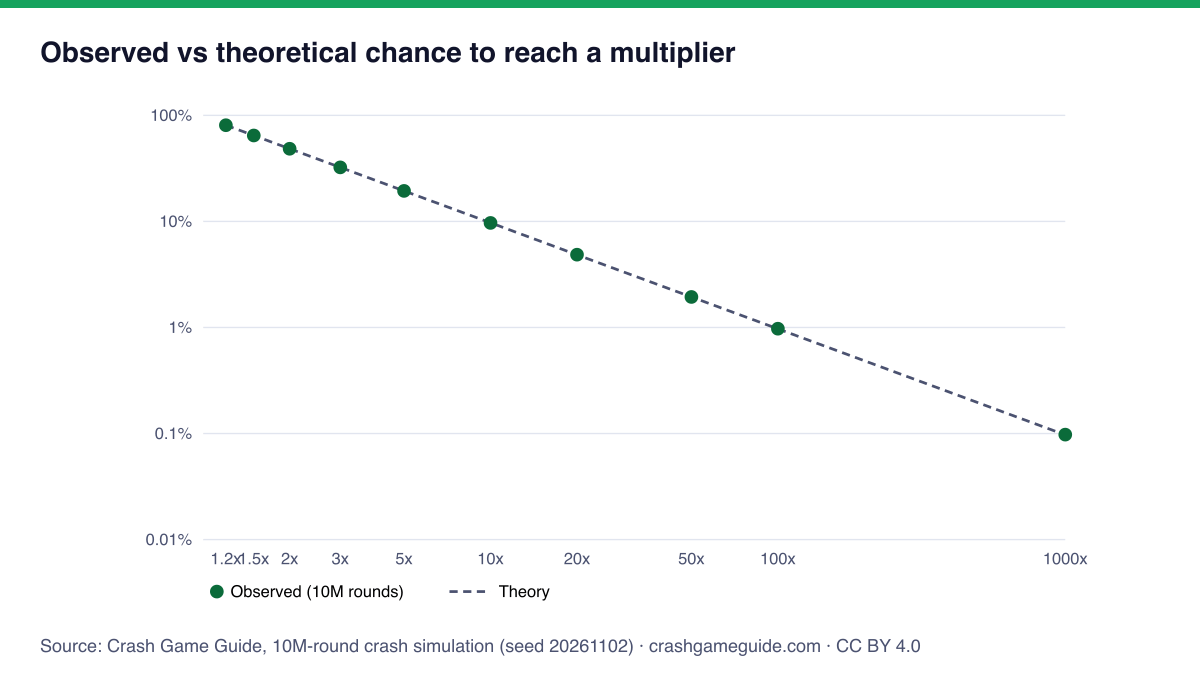
The chance to reach any multiplier x is (1 − house edge) ÷ x. Over 10 million rounds the observed numbers sit right on that line: 2x came up 48.5% of the time (theory 48.5%), 10x 9.7% (theory 9.7%), 1,000x 0.10% (theory 0.10%). That’s the maths behind every cash out you set; use our auto cash out calculator to get it for any target.
6. The streak myth, tested
Show data table
| k | P(≥ 2x) |
|---|---|
| 0 | 48.5% |
| 1 | 48.5% |
| 2 | 48.5% |
| 3 | 48.6% |
| 4 | 48.4% |
| 5 | 48.4% |
| 6 | 48.5% |
| 7 | 48.6% |
| 8 | 47.8% |
Embed this chart
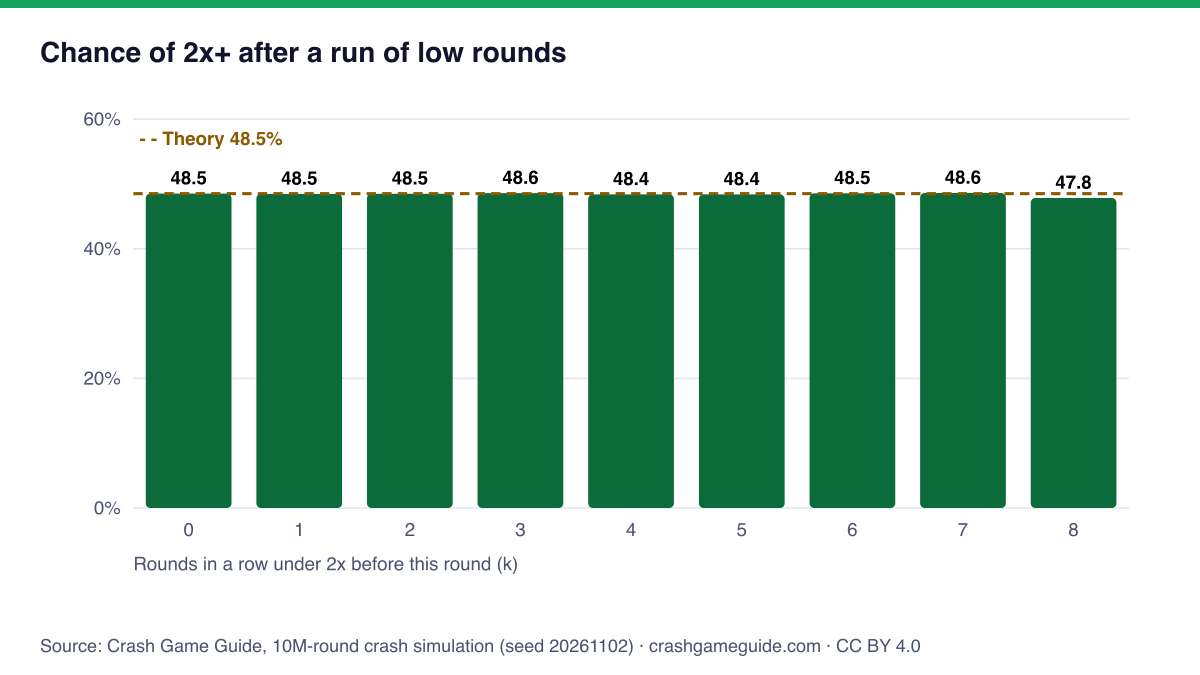
“It’s been low for ages, a big one is due” is the most common belief in crash games, and it’s what predictor apps and signal groups sell. The data says no. The chance of 2x stays flat whether the previous rounds were high or low, and the correlation between one round and the next is 0.0003, which is zero for practical purposes. The longest run below 2x in our 10 million rounds was 24 rounds. You can check any real round yourself with our provably fair verifier.
7. How much the house edge matters
Show data table
| Strategy | 1% | 3% | 4% |
|---|---|---|---|
| Auto cash out 1.20x | 24.0% | 1.9% | 0.4% |
| Auto cash out 2x | 36.3% | 16.1% | 9.4% |
| Auto cash out 10x | 41.1% | 33.6% | 29.8% |
| Martingale (2x) | 16.6% | 12.0% | 9.7% |
| Fibonacci (2x) | 31.1% | 22.9% | 19.1% |
| Martingale + take-profit +20 | 81.8% | 79.1% | 77.6% |
Embed this chart
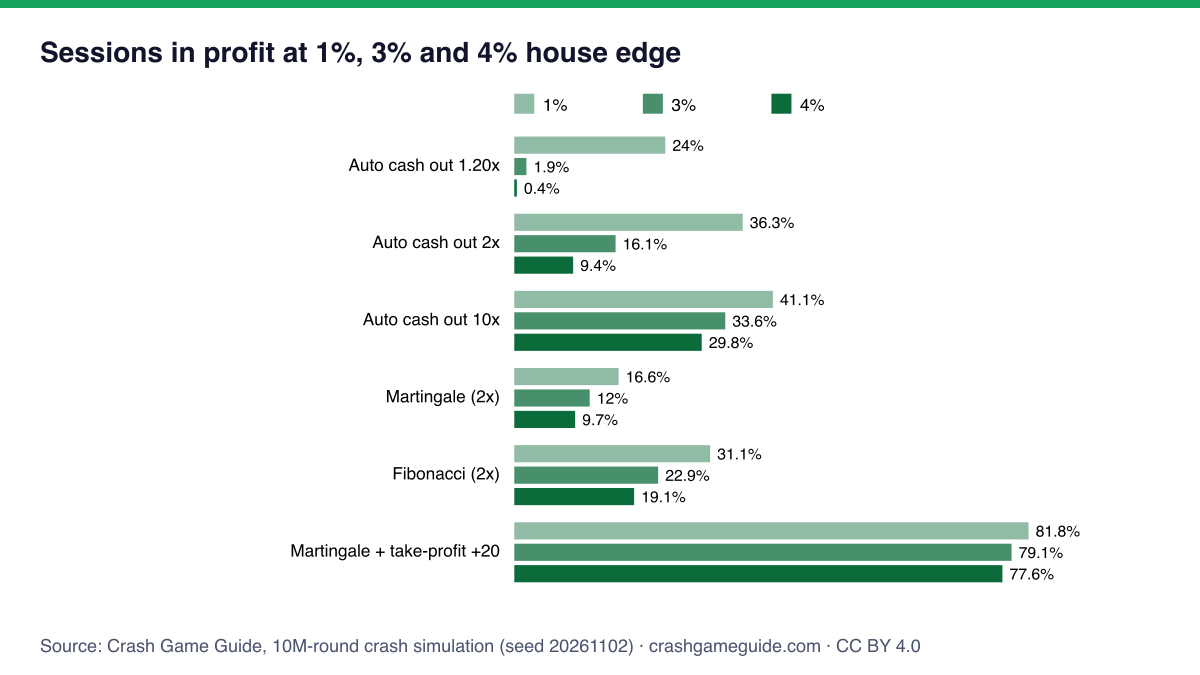
Same rounds, different edge. Moving from 3% to 1% lifts the share of winning sessions for every strategy, and 4% pushes it down. Picking a game and casino with a higher RTP is the one choice that changes your long-run numbers. Compare RTPs on our crash games list.
What this means for your play
- Pick the ride, not a “system”. Low targets give long, calm sessions; high targets give fewer, bigger wins. Both pay back about 97% over time.
- Set a take-profit. Martingale with a +20 stop finished up in four sessions out of five. Banking wins is what turns a good run into a good night.
- Size the bet to the bankroll. Every bust in this study came from the bankroll running out before the session did. At 2x, a run of 24 losses in a row happened in our data, so plan for long cold runs.
- Ignore anyone selling patterns. Rounds are independent. Our guide to how to win at crash games covers what actually helps.
Try any of these strategies with your own numbers in the Martingale simulator or the free crash game.
Methodology
- Rounds: 10,000,000 crash points from the mulberry32 generator, seed 20261102. Formula: crash = max(1, floor(100 × (1 − edge) ÷ (1 − U)) ÷ 100), U uniform on [0, 1).
- Sessions: 10,000 per strategy, each using the same block of 1,000 rounds; every strategy saw identical crash points.
- Bankroll: 100 units, base bet 1 unit. A session stops when the bankroll is below one base bet (bust), when a stop-loss or take-profit is hit, or after 1,000 rounds. Bets are capped at the remaining bankroll.
- Strategies: fixed auto cash out at 1.20x, 1.50x, 2x, 5x and 10x; Martingale, Anti-Martingale (Paroli, reset after 3 wins), D’Alembert and Fibonacci at 2x; a dual bet of 1 unit at 1.20x plus 1 unit at 10x; and three stop-loss/take-profit variants.
- Metrics: final bankroll percentiles, bust rate, share of sessions in profit, average rounds before bust, max drawdown, longest losing streak, biggest single win, hit rate and return to player.
- Reproducibility: the script is public and running it twice gives identical output. Full results: CSV.
Limitations
This models a generic crash game with the standard distribution. Real games add their own rules: maximum win caps, different house edges, minimum and maximum bets, and features like rain or free bets. Sessions here are 1,000 rounds with fixed units; real players stop and restart. None of this changes the core result, which holds for every strategy tested: no betting pattern changes the house edge, it only changes how the ride feels.
Cite this study
Free to reuse under CC BY 4.0 with a link back.
APA
Foster, D., & Crash Game Guide. (2026). We Simulated 10 Million Crash Game Rounds: Here's What Actually Happens [Data set]. Crash Game Guide. https://crashgameguide.com/research/crash-game-simulation-study/ Plain link
https://crashgameguide.com/research/crash-game-simulation-study/ HTML embed
<a href="https://crashgameguide.com/research/crash-game-simulation-study/">Crash Game Guide 10-million-round crash game simulation study</a> Frequently asked questions
What did the 10 million round crash game simulation find?
Every strategy returned about 97% of the money wagered, the same as the house edge allows. Progressions like Martingale won small amounts often but lost the whole bankroll in most sessions, while low fixed cash outs rarely busted but slowly drifted down.
Which crash game strategy finished in profit most often?
Martingale at 2x with a +20 unit take-profit ended in profit in about 79% of sessions, but the other 21% lost the entire 100-unit bankroll. High fixed targets like 10x won in about a third of sessions with much smaller losses on the rest.
Do crash games have patterns or streaks you can predict?
No. Across 10 million rounds the chance of the next round reaching 2x stayed at about 48.5% no matter how many low rounds came before it, and the round-to-round correlation was effectively zero. Each round is independent.
How often does a crash game reach 100x?
In our simulation at a 3% house edge, about 0.97% of rounds reached 100x or more, matching the theoretical 0.97%. That is roughly one round in 103 on average, with long gaps in between.
Can I use the data and charts?
Yes. The CSV, charts and press kit are free to reuse under CC BY 4.0. Credit Crash Game Guide with a link to this study; embed codes and citations are on the page.
Is the simulation reproducible?
Yes. It uses a fixed seed (20261102) with the mulberry32 generator and the standard crash formula. Running the published script gives byte-identical results.
Sources
- Crash Game Guide simulation script (seed 20261102) (checked November 2, 2026)
- Bustabit verifier: published crash formula (checked November 2, 2026)
- Spribe Aviator: game rules and RTP (checked November 2, 2026)

Crash Game Maths & Mechanics Analyst
Daniel focuses on the mathematics and mechanics behind crash games. His reviews examine RTP disclosures, volatility, multipliers, game mechanics and the mathematical principles behind different crash titles.
✓ Fact-checked by Alex Morgan (Casino & Crash Game Reviewer)
Published · Updated